
Wondering which types of digital marketing may be suitable for your campaigns? Marketing online can be daunting, particularly if you still think in terms of traditional channels like television, radio, and newspaper advertising. It can sometimes be difficult to determine the effectiveness of the various new digital marketing channels.
The world of digital marketing is rapidly changing, and what may have been popular a year ago may be out-of-date and passé today. We thought that it was time to collate a wide range of digital marketing statistics to establish trends and determine the winners (and losers) of digital marketing today.
Top 69 Digital Marketing Statistics for 2024:
What is Digital Marketing in 2024?
The first thing we need to establish in this post is what constitutes digital marketing. We recently examined this issue in What Is Digital Marketing? and determined that digital marketing is the “use of strategy, planning, and a keen understanding of your market to create targeted digital media that drive awareness and education for your brand and product/services, and ultimately sales”.
This is a very broad definition and covers a wide range of digital media and channels. These include:
- Search Engine Optimization (SEO)
- Content Marketing
- Search Engine Marketing (SEM)
- Social Media Marketing
- Influencer Marketing
- Email Marketing
- Mobile Marketing
- Video Marketing
Digital Marketing Industry Statistics
1. Somewhere between 5.11 and 5.46 billion people use the internet, depending on which source you prefer. That makes internet usage somewhere between 63.1 and 67.4% of the global population. The internet adoption rate varies greatly by where people live, however. The regions with the highest internet uptake are Northern Europe (97.4%), Northern America (96.9%), Western Europe (95.5%), and Southern Europe (90.2%). However, there is less opportunity for digital marketing in a few other regions, for example, Eastern Africa (26.8% usage), Middle Africa (32.1%), and Western Africa (42.3%). (Digital 2024 April Global Statshot Report)
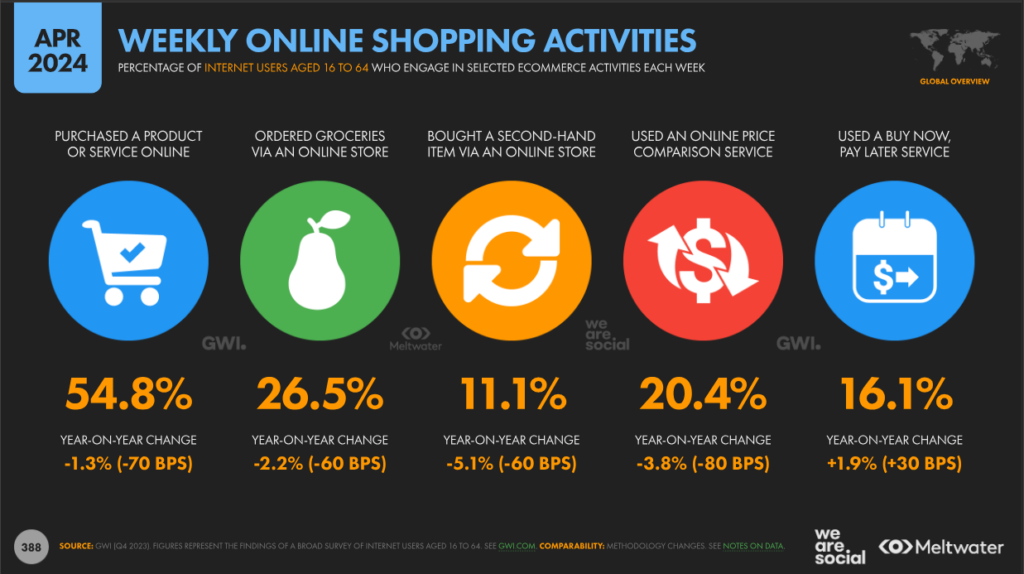
2. 54.8% of internet users aged 16 to 64 purchased a product or service online in Q4 2023. 26.5% ordered groceries via an online store. 11.1% bought a second-hand item via an online store. (Digital 2024 April Global Statshot Report)
3. Free delivery (50.9%) is the biggest factor that encourages consumers to make an online purchase. This is followed by coupons and discounts (39.5%), customer reviews (32.6%), next-day delivery (31.8%), an easy returns policy (31.4%), and a simple online checkout (30.4%). (Digital 2024 April Global Statshot Report)
4. Amazon has the most used mobile shopping app, followed by Shopee, Flipkart (from Walmart), Shein, and Temu. (Digital 2024 April Global Statshot Report)
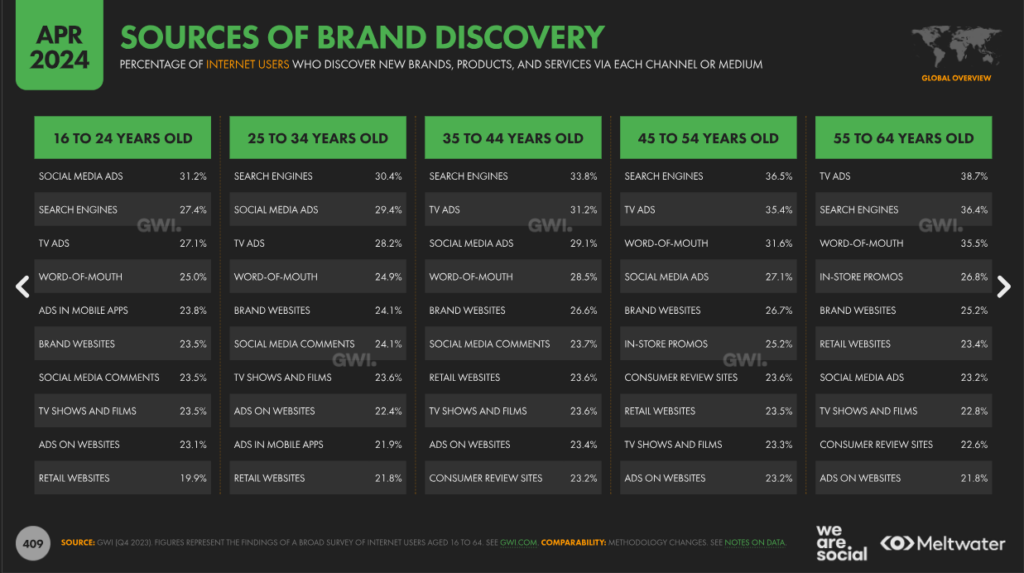
5. Overall, search engines (32.3%) are still the most common way internet users discover new brands, products, and services. This is followed by TV ads, (31.0%), social media ads (28.7%), word-of-mouth (28.1%), and brand websites (25.1%). However, things vary by age, with 16-24 year-olds most preferring to find new items via social media ads, 25-54 year-olds via search engines, and 55-64 year-olds via TV ads. (Digital 2024 April Global Statshot Report)
6. 32.1% of internet users aged 16 to 64 admit to using an ad blocker for at least some of their online activities. In all age brackets, more males than females use ad blockers. When asked why they used ad blockers, 62.7% of respondents said they did so because there were too many ads, followed by 53.6% who felt ads get in the way. In addition, 34.8% decline cookies at least some of the time. (Digital 2024 April Global Statshot Report)
7. Marketers with effective strategies in 2023 consider increasing revenue and sales (24%) to be their top goal in 2024. Other important goals they have include increasing brand awareness and reaching new audiences (19%), increasing engagement (19%), improving sales-marketing alignment (16%), and driving traffic to a brand website (15%). (HubSpot State of Marketing Report 2024)
8. HubSpot’s respondents found that the following trends generated strong results in 2024: short-form videos (17%), content showing brand values (13%), influencer marketing campaigns (12%), selling on social media apps (12%), and having a mobile-friendly website (11%). (HubSpot State of Marketing Report 2024)
9. At the time the survey was taken for HubSpot’s State of Marketing 2024 report (September 2023), 47% of their respondents were working on a plan to approach cookie-free targeting. (HubSpot State of Marketing Report 2024)
10. eMarketer predicts that digital ad spending worldwide will hit $667.58 billion this year, up 10.9% from $601.84 billion in 2023. They expect digital ad spending to reach $870.85 billion by 2027. (eMarketer).
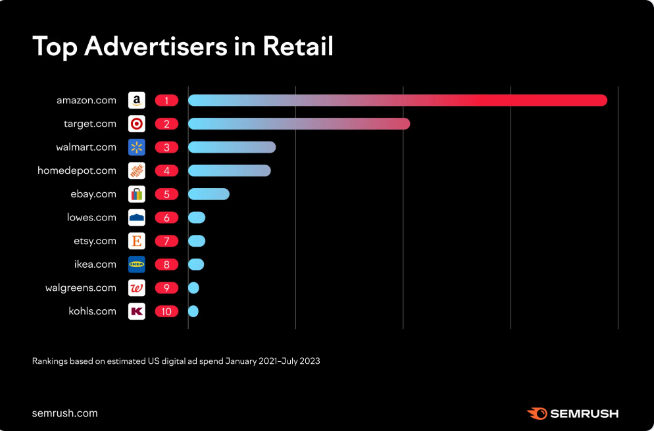
11. The top advertiser in the retail industry was Amazon, followed closely by Target and Walmart. One caveat about Amazon’s spending (alongside ad spending by Etsy and eBay which are also in the top 10) is that they have a marketplace, and any spending by small sellers sending people to their marketplace listings shows up as ad spending by the marketplace. (SEMrush)
Digital Marketing Job Statistics
12. Coursera ranked eCommerce (which they defined as “buy and sell products or services through digital channels”) as the #1 fastest-growing business skill. Other relevant skills they included on their list were search engine optimization (#4) and marketing management (#10). (Coursera Job Skills of 2024)
13. The Bureau of Labor Statistics predicts that jobs for Advertising, Promotions, and Marketing Managers are predicted to grow by 6% between 2022 and 2032, which is faster than average. The median annual wage for advertising and promotions managers in the USA was $131,870 in May 2023, and the median annual wage for marketing managers was $157,620. (Bureau of Labor Statistics, U.S. Department of Labor)
Digital Marketing – Search Engine Optimization (SEO) Statistics
14. Don’t underestimate people’s use of search engines. 81.8% of internet users aged 16 to 64 visited or used a search engine or web portal in the past month. (Digital 2024 April Global Statshot Report)
15. As of April 2023, Google held an incredible 90.91% of the search engine market share worldwide. They were distantly followed by Bing (3.64%), Yandex (1.15%), Yahoo (1.13%), and DuckDuckGo (0.55%). (StatCounter Global Stats)
16. Google now processes over 40,000 search queries every second on average. This translates to over 3.5 billion searches per day and 1.2 trillion searches per year worldwide. (Internet Live Stats).
17. The top-ranked result in Google’s organic search results features a CTR of 9.28%, followed by 5.82 and 3.11% for positions two and three, respectively. (Aslib Journal of Information Management article)
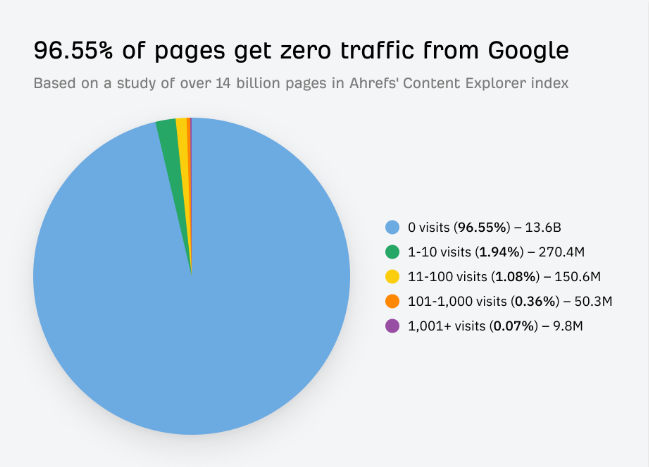
18. 96.55% of all pages get zero traffic from Google, and 1.94% get between one and ten monthly visits. Only 0.07% of web pages receive more than 1,000 visits. (Ahrefs)
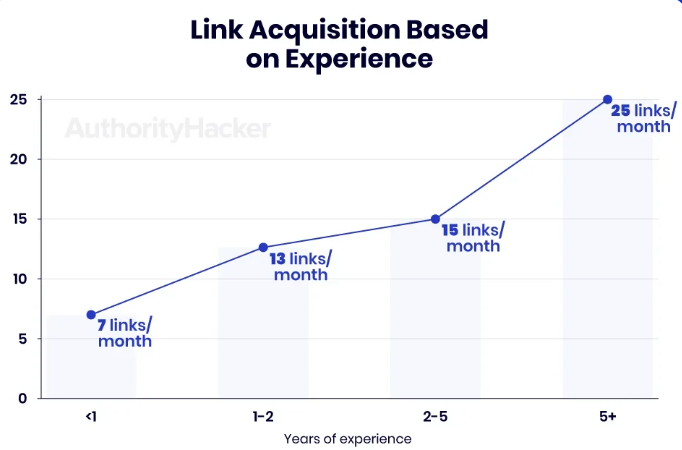
19. Becoming a good link builder takes time. An Authority Hacker study found that there is a clear correlation between link acquisition and experience. Link builders with less than a year of experience build an average of just 7 links per month. By the time the average link builder has five years’ experience, they can build 25 links/month. (Authority Hacker)
20. 74% of link builders now pay for links. However, that doesn’t mean they pay old-style link farms for useless non-SEO links. The average cost of a paid link across all business types and experience levels is $83. (Authority Hacker)
Digital Marketing – Content Marketing Statistics
21. SEMrush found that 67% of the respondents to their survey used AI tools for content marketing and/or SEO. (SEMrush Think Big with AI 2024)
22. HubSpot asked their marketer respondents how they used AI to create content. The most common use is for ideas and inspiration (45%), followed by to create outlines (31%), and to draft content (18%). However, just 6% use it to write content. (HubSpot State of Marketing Report 2024)
23. 85% of marketers report that AI improved content quality. 84% of marketers said AI tools enhanced efficiency in creating content. 82% of marketers said that AI increased their capabilities for content production. Overall, 85% of marketers believed generative AI would have a transformative impact on content creation in 2024. (HubSpot State of Marketing Report 2024)
24. In businesses that don’t use AI, the bulk (79%) of the writing for content marketing is done by a marketing manager (or “boss” if they don’t have a Marketing department). 17% of these businesses use an in-house writer and 14% work with freelance writers. 2% use some other means to source their content. (SEMrush Think Big with AI 2024)
25. 24% of non-AI firms spend less than 5 hours on a content piece, 39% spend 5-10 hours, 24% spend 11-20 hours, 9% spend 21-40 hours, and 4% spend more than 40 hours. (SEMrush Think Big with AI 2024)
26. These numbers change notably in firms using AI for their content production: 40% spend less than 5 hours on a content piece, 36% spend 5-10 hours, 16% spend 11-20 hours, 6% spend 21-40 hours, and 2% spend more than 40 hours. (SEMrush Think Big with AI 2024)
Digital Marketing – Search Engine Marketing (SEM) Statistics
27. The average search ad Click-Through Rate (CTR) was 1.59% in Q1 2024, up slightly from the equivalent quarter in 2023. The average Cost Per Click (CPC) was $0.59 in Q1 2024, compared to $0.51 a year previously. (Digital 2024 April Global Statshot Report)
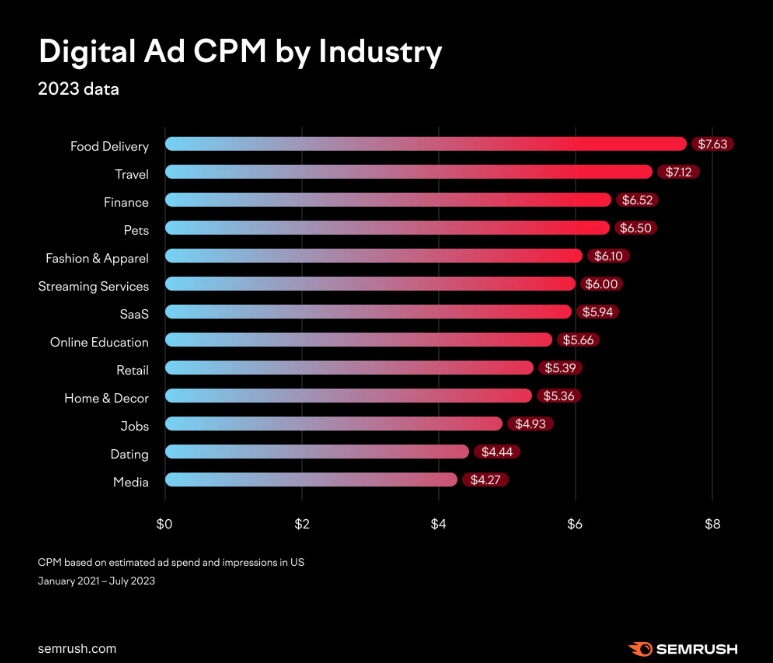
28. Food delivery was the industry with the highest digital ad CPM in 2023 ($7.63). Other high-paying industries include Travel ($7.12), Finance ($6.52), and Pets ($6.50). Industries with cheaper average CPMs included Media (4.27), Dating ($4.44), and Jobs ($4.93). (SEMrush CPM Benchmarks by Industry)
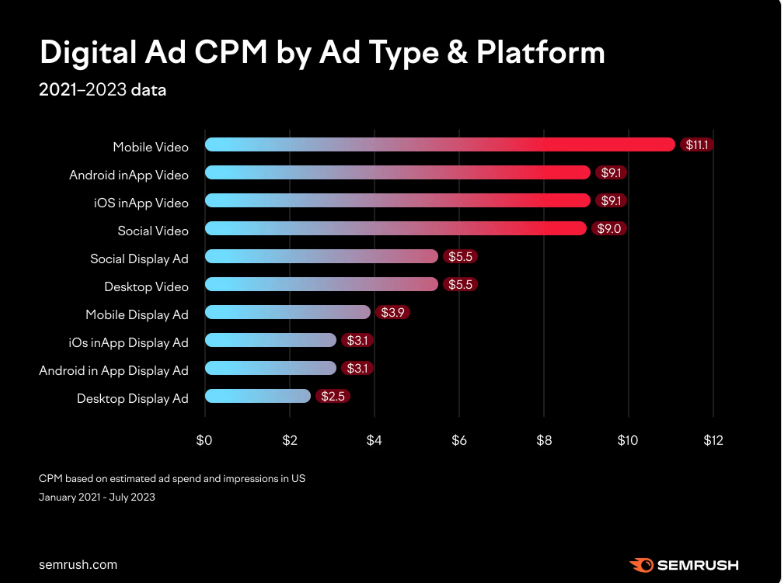
29. Mobile video is the format with the highest average CPM ($11.10), followed by Android and iOS in-app Videos ($9.10) and Social Video ($9.00). More traditional advertising formats were cheaper, having lower average CPMs, e.g. Desktop Display Ads ($2.50), Android and iOS app Display Ads ($3.10), and Mobile Display Ads ($2.50). (SEMrush CPM Benchmarks by Industry)
Digital Marketing – Social Media Marketing Statistics
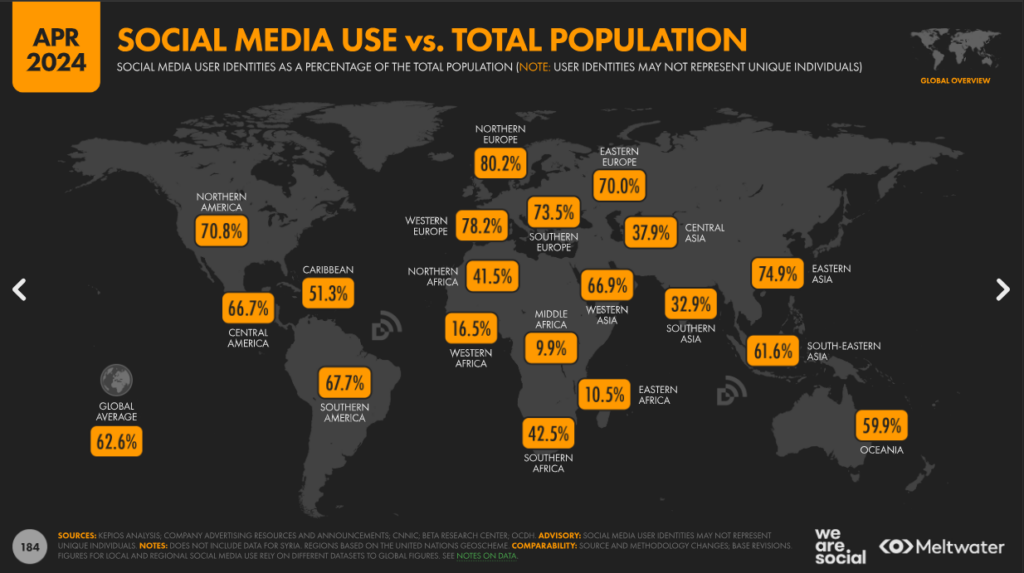
30. There are currently 5.07 billion social media user identities globally, 62.6% of the world’s population, and your social media marketing audiences will be a proportion of this. This is a 259 million (5.4%) increase over the last year. (Digital 2024 April Global Statshot Report)
31. 93.3% of internet users aged 16 to 64 use social media. (Digital 2024 April Global Statshot Report)
32. Social media use varies greatly across the globe (and digital marketers need to recognize this when searching for their target audiences). Social media is most popular in Northern Europe (80.2% usage rate), followed by Western Europe (78.2%), Eastern Asia (74.9%), Southern Europe (73.5%), Northern America (70.8%), and Eastern Europe (70.0%). It is far less prevalent in Middle Africa (9.9%), Eastern Africa (10.5%), and Eastern Africa (16.5%). (Digital 2024 April Global Statshot Report)
33. Social media users average 2 hours and 20 minutes per day using social media. This is 35.4% of the total time they spend using the internet. (Digital 2024 April Global Statshot Report)
34. Social networks are the second most common type of websites visited/apps used (94.9%), with only Chat and Messaging sites/apps (95.2%) having greater usage. 16-24-year-olds are an outlier, using social media (97.1%) more often than chat & messaging apps (96.6%). (Digital 2024 April Global Statshot Report)
35. Facebook has a potential advertiser reach of 2.24 billion, compared to Instagram (1.69 billion) and TikTok (1.58 billion). Despite this, social media users claim Instagram to be their favorite social media platform (16.6%), followed by WhatsApp (16.3%), WeChat (13.0%), Facebook (12.7), and TikTok (7.9%). TikTok’s position is improved in this statistic, however, if you include its Chinese sibling, Douyin (6.7%). (Digital 2024 April Global Statshot Report)
36. 49.5% of social media users aged 16 to 64 visit social media to learn about brands and see their content. 73.3% use social media to research brands and products they’re considering buying. The most commonly used social networks for brand research are Instagram (62.7%), Facebook (53.8%), TikTok (47.4%) and Pinterest (36.8%). (Digital 2024 April Global Statshot Report)
37. By far the greatest number of web traffic referrals from social media to third-party sites (i.e. clicks or taps on links in social posts) occur on Facebook (62.15%). This is distantly followed by Instagram (11.74%), YouTube (8.63%), Pinterest (7.67%), and X/Twitter (7.51%). Surprisingly, Facebook’s dominance in sending link traffic is down from March 2017, when it sent 87.15% of social web traffic. (Digital 2024 April Global Statshot Report)
38. Socialinsider data suggest photo posts have the greatest engagement (as a percentage of total page followers) on Facebook (0.35%), followed by video posts (0.23%), album posts (0.22%), Reels posts (0.21%), status posts (0.10%), and link posts (0.08%) (Digital 2024 April Global Statshot Report)
39. There are now more video posts on Instagram than photo posts (from business accounts anyway). 40.8% of main feed posts from business accounts are video posts, compared to 38.4% photo posts, and 20.8% carousel posts. (Digital 2024 April Global Statshot Report)
40. The average social media ad Click-Through Rate (CTR) was 0.73% in Q1 2024, down slightly from the equivalent quarter in 2023. The average Cost Per 1000 Impressions (CPM) was $5.60 in Q1 2024, compared to $5.40 a year previously. (Digital 2024 April Global Statshot Report)
41. HubSpot’s survey respondents still prefer to use Facebook most for their social marketing (57%) and consider it to have the top (equal) ROI (29%). Sibling app, Instagram, comes second with 55% using it, and 29% considering that it offers the best ROI. Usage and ROI stats for the other social channels are:
- YouTube (52% usage, 26% receiving highest ROI),
- TikTok (44% usage, 24% receiving highest ROI),
- X/Twitter (39% usage, 16% receiving highest ROI),
- LinkedIn (37% usage, 16% receiving highest ROI),
- Snapchat (22% usage, 6% receiving highest ROI),
- Pinterest (21% usage, 6% receiving highest ROI),
- Twitch (16% usage, 5% receiving highest ROI),
- Tumblr (9% usage, 2% receiving highest ROI).
(HubSpot State of Marketing Report 2024)
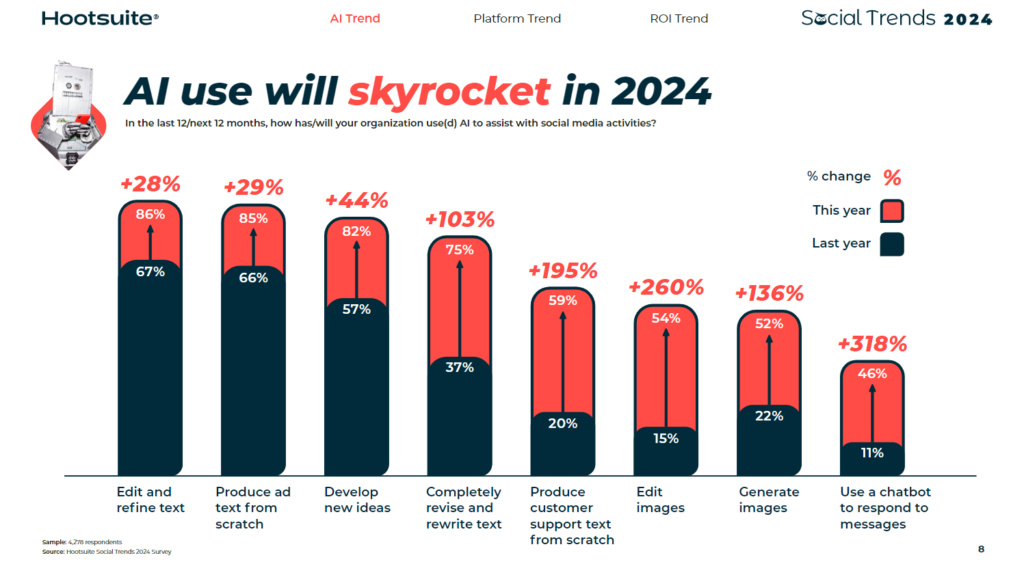
42. Social media managers responding to Hootsuite’s latest Social Media Trends report expect to greatly increase their use of AI over this coming year. 61% said that the #1 reason they use AI for social media is to reduce staff workload. Of those intending to use AI for their social work:
- 86% intend to edit and refine text
- 85% intend to produce ad text from scratch
- 44% intend to develop new ideas
- 75% intend to use AI to completely revise and rewrite text
- 59% intended to produce customer support text from scratch
- 54% intend to use it to edit images
- 52% intend to use it to generate images
- 46% intend to use a chatbot to respond to messages
(Hootsuite Social Media Trends 2024)
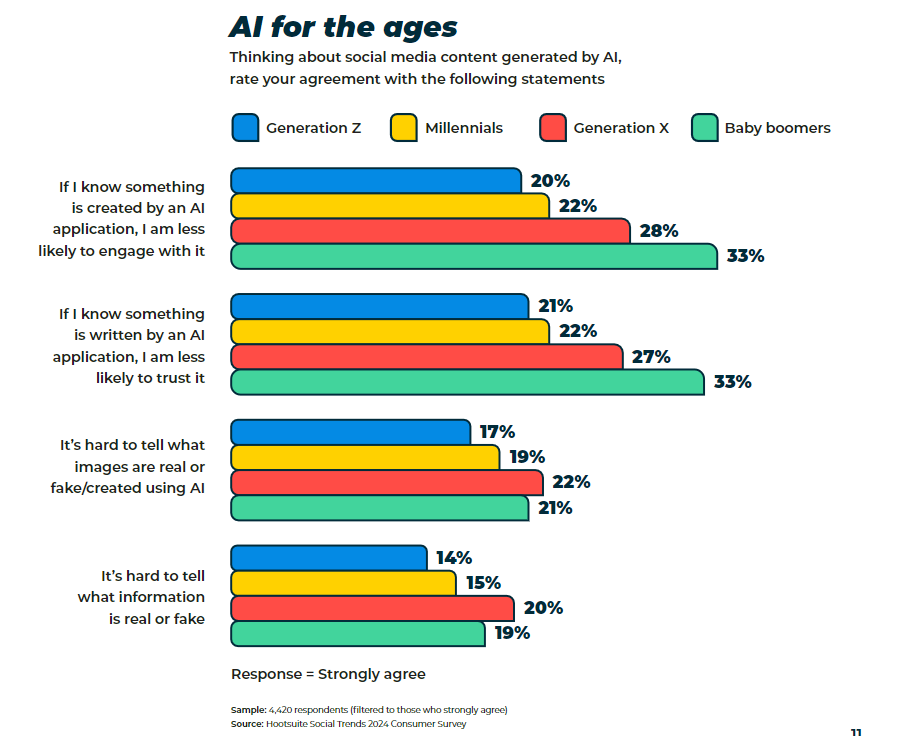
43. Unfortunately, the counter to Hootsuite’s above finding is that 62% of consumers say they are less likely to engage with and trust content if they know it was created by an AI application. Social media managers may love the ways AI can simplify their daily work, but they have yet to impress the consumers who interact with their social posts. (Hootsuite Social Media Trends 2024)
44. When broken down by generation, distrust is greatest in Baby Boomers and least in Generation Z (Hootsuite Social Media Trends 2024)
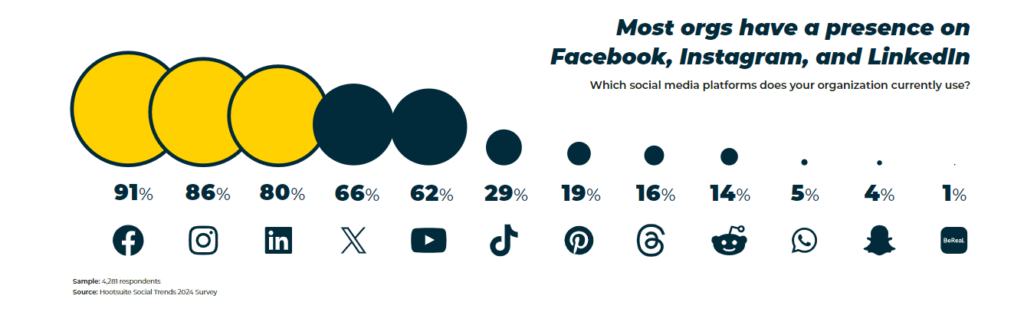
45. Facebook remains the social platform of choice for businesses, with 91% having a presence there. Instagram follows closely with 86% of businesses having accounts, followed by LinkedIn (80%), X/Twitter (66%), and YouTube (62%). TikTok may be rapidly growing in popularity with consumers, but only 29% of businesses have a presence on the platform yet. However, interest in TikTok by businesses grew by 16% over 2022-2023. (Hootsuite Social Media Trends 2024)
46. Consumers consider an emphasis on self-promotion and low-quality content to be a killer for brands on social media. Hootsuite asked their respondents about the negative activities that brands did on social media. The most offending activities were:
- Being too focused on self-promotion (34%)
- Low-quality content (32%)
- Poor engagement with public comments or direct messages (27%)
- Slow responses to public comments or direct messages (26%) (Hootsuite Social Media Trends 2024)
47. The world may be going through tough economic times at the moment, but social networks seem to be benefiting at the expense of many traditional marketing platforms. Mediaocean asked 117 leading retail marketing industry professionals about whether they intended to increase or decrease their spending on 10 advertising channels. The channel they most intend to increase their spending on is social media (+72%), followed by digital display/video (63%), and connected TV (59%). An omen for traditional media is that 35% of respondents intended to reduce their print advertising, followed by local TV (-28%). (2024 Retail Advertising Outlook Report)
Digital Marketing – Influencer Marketing Statistics
48. 22.5% of social users aged 16 to 64 say they follow influencers or other experts on social media. (Digital 2024 April Global Statshot Report)
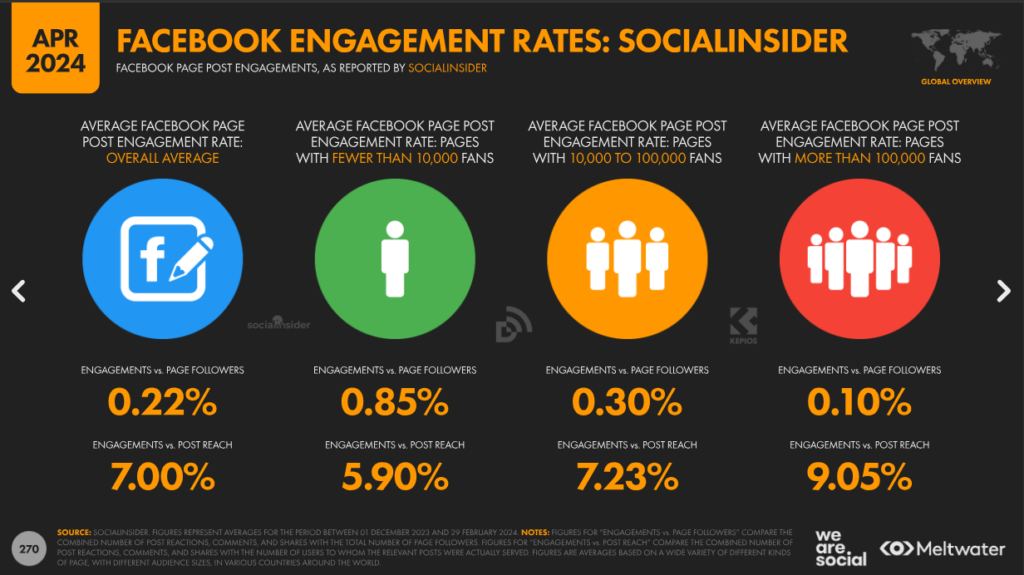
49. While Facebook influencers (pages with >100,000 followers) have the lowest engagement with page followers, they have the highest engagement concerning post reach. (Digital 2024 April Global Statshot Report)
50. 51% of marketers say their company worked with creators or influencers in 2023. More B2C brands worked with influencers than those operating B2B. (HubSpot State of Marketing Report 2024)
51. 49% of marketers that partner with influencers work with them multiple times. Many brands now value influencers who assist them with successful campaigns and repeat the partnership in future campaigns. (HubSpot State of Marketing Report 2024)
Digital Marketing – Email Marketing Statistics
52. Email may no longer be a new and fancy use of technology, but it is still popular. 74.3% of internet users aged 16 to 64 say they used email in the past month. (Digital 2024 April Global Statshot Report)
53. Litmus asked respondents to its survey what they thought to be the most effective marketing channel. The respondents favored email marketing (41%), followed by social media marketing (16%), paid search/ads (16%), organic search (9%), and video (3%). (Litmus 2023 State of Email Report)
54. 87% say email is critical to their success, yet 36% of marketers aren’t measuring email ROI. (Litmus 2023 State of Email Report)
55. Creating the emails for an email marketing campaign isn’t as simple as you would imagine. 44% of marketers say they build 2-3 versions of every email, on average, while 18% build 4-6 versions. (Litmus 2023 State of Email Report)
56. It can also take surprisingly long to create emails for email marketing. 21% of email marketing teams say they can prepare an email in a week. However, 62% of email marketing teams take two weeks or more to build an email. 23% of teams have up to 5 emails in production at any given time. (Litmus 2023 State of Email Report)
57. The most successful way to gain subscribers for your email list is via a sign-up form on your home page (37%), followed by online registration for webinars or events (33%), followed by some other customer-facing page of your website (33%). (Litmus 2023 State of Email Report)
58. The most common automation sequence is for onboarding or post-purchase emails (55%). The next most popular sequences are for subscriber re-engagement (32%), and customer reactivation or winback (31%). The most common types of emails that are automated are those recognizing a birthday, anniversary, or other milestone (48%), subscriber re-engagement (34%), and rating, review, or net promoter score (NPS) (31%). (Litmus 2023 State of Email Report)
59. Growing sales/revenue is the top equal email marketing KPI alongside boosting customer retention (41%), closely followed by generating marketing or sales-qualified leads (40%). (Litmus 2023 State of Email Report)
Digital Marketing – Mobile Marketing Statistics
60. There are now 5.65 billion unique mobile phone subscribers, 69.7% of the world’s population, so any mobile marketing you do will be a subset of this. This is a 133 million (2.4%) increase over the last year. (Digital 2024 April Global Statshot Report)
61. 97.8% of internet users aged 16 to 64 own a mobile phone. Nearly all of these (97.6% of internet users) are now smartphones. Tablet usage, however, continues a slow decline, with 31.3% owning a tablet (down 0.9% YoY). (Digital 2024 April Global Statshot Report)
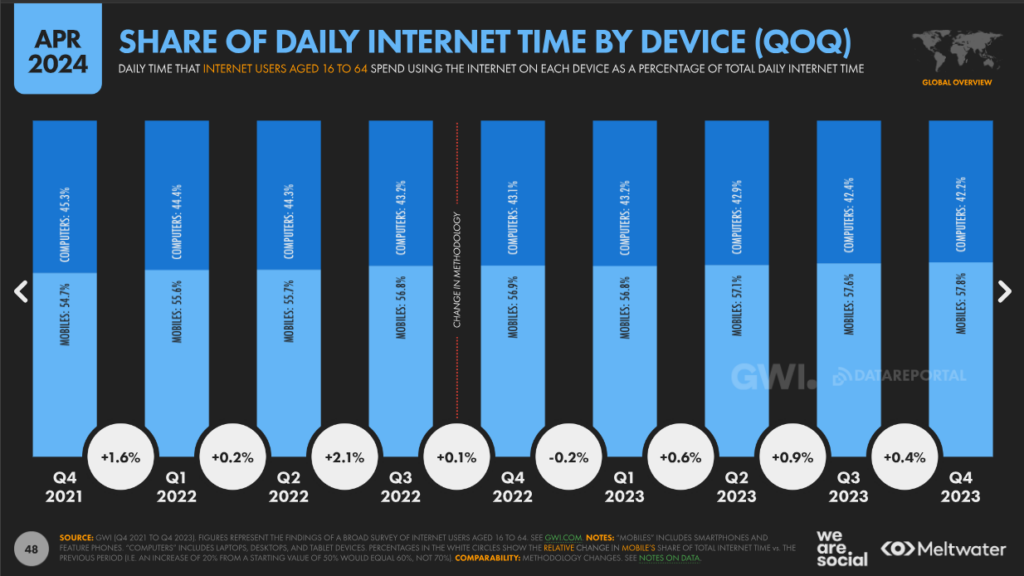
62. By Q4 2024, 57.8% of internet time was accessed by using mobile devices, with only 42.2% being via computer. (Digital 2024 April Global Statshot Report)
63. 49.7% of internet users aged 16 to 64 use or scan QR codes on their mobile each month. Perhaps surprisingly, the most avid users of QR codes are 35-44-year-old males (53.5%). Digital marketers in China should take an even greater interest in this technology, with 64.4% of the Chinese population using QR codes. (Digital 2024 April Global Statshot Report)
64. An analysis of click-throughs on mobile shows that:
- 43.1% are organic clicks (clicks to any external website on the search engine results page (SERP),
- 29.3% are Google keywords (clicks that move the searcher to a Google search for a different keyword),
- 17.3% are zero clicks (i.e. no click within two minutes of coming to a SERP),
- 10.3% are Google clicks (actions that change the URL but keep the user in Google, e.g. Images, news, etc.),
- 0.02% are paid clicks (clicks to paid ads on the SERP) (SEMrush Zero Clicks Study)
Digital Marketing – Video Marketing Statistics
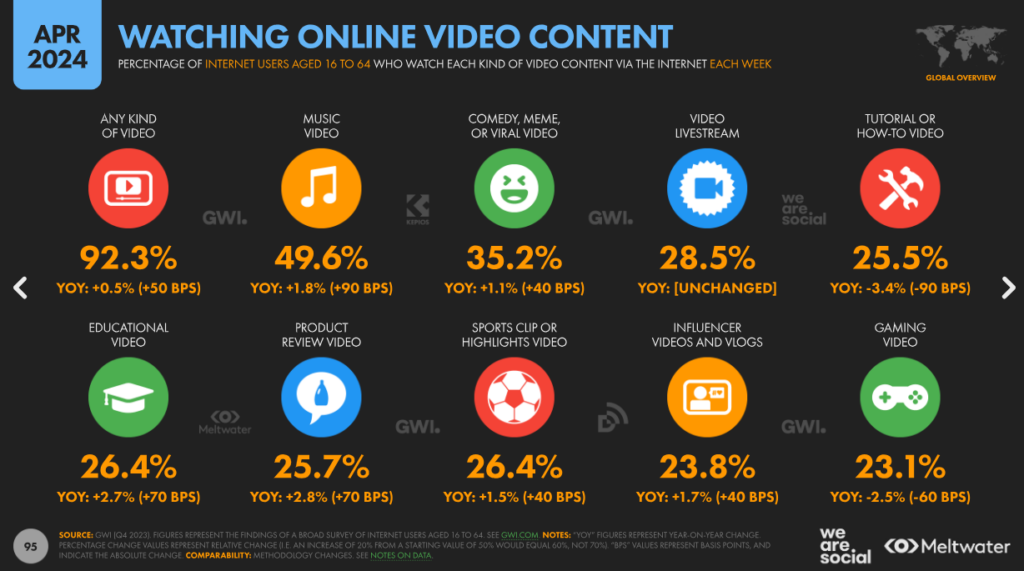
65. 92.3% of internet users aged 16 to 64 watch video content via the internet each week. These cover a range of video types, although the most popular types of videos are music videos (viewed by 49.6%) and comedy, meme, or viral videos (35.2%). The video category that saw the most growth last year was product review videos (+2.8% YOY growth). (Digital 2024 April Global Statshot Report)
66. YouTube has a potential advertising reach of 2.5 billion. Its highest advertising reach is in India (476 million) followed by the USA (238 million). (Digital 2024 April Global Statshot Report)
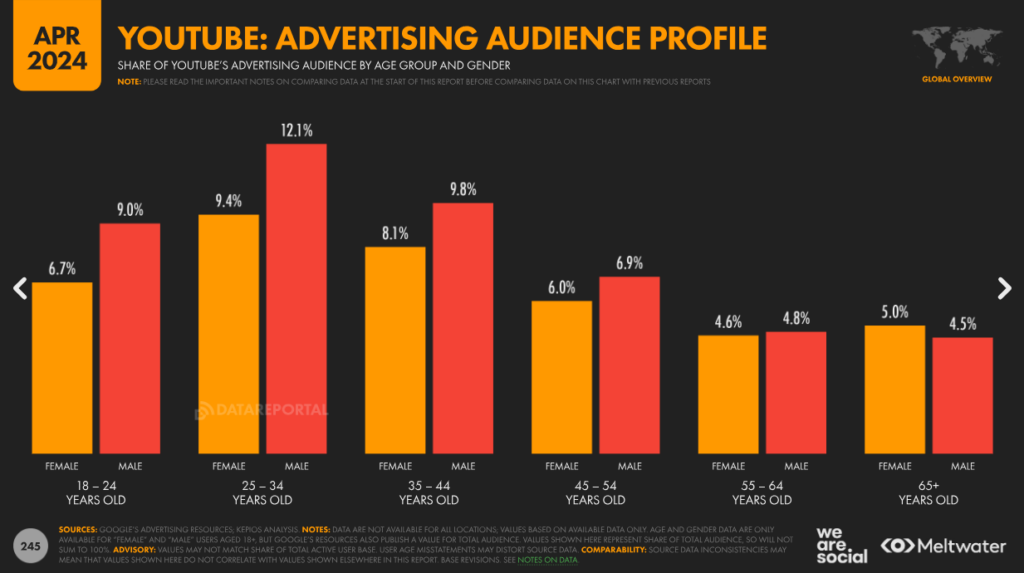
67. YouTube is more watched by males than females. 54.3% of its ad reach is males, compared to 45.7% females. 25-34-year-old males are particularly beloved of YouTube (12.1% of YouTube’s advertising audience). (Digital 2024 April Global Statshot Report)
68. 56% of marketers using TikTok will increase their investment next year. (HubSpot State of Marketing Report 2024)
69. 30% of marketers who don’t use short-form videos intend to start in 2024. (HubSpot State of Marketing Report 2024)
About the Author
![]()
Writer
Djanan Kasumovic, a dynamic force in digital marketing, leads as the Head of Growth at Influencer Marketing Hub. His distinguished career includes roles at high-profile companies like SnappCar, a leader in European car sharing, Travelbird, Kids Luxury Group and B&S. Djanan has been at the forefront of innovative digital marketing processes, mastering areas such as AI content production, AI marketing, and AI influencer marketing, establishing himself as a pioneer in these fields.


