
Marketers work with search data every day, but we’re greatly underutilizing its potential.
Let me explain.
Search data can tell us all kinds of things about markets, audiences, behavior, and preferences. It’s a source of intelligence that informs smarter, better, more timely business decisions beyond SEO.
In this article, I’ll introduce you to a different way of looking at “search data.”
We’ll talk about sources, which data to pull, and how to use it to arrive at powerful insights quickly.
What Is Search Data?
Search data is any data collected when a user searches a public website by entering a query string to find relevant information (products, information, or answers) from a library of different content (website pages, media) published from different sources (websites, creators).
When people conduct this type of search, they take direct action driven by a need. Put more simply, search data is “active demand.”
Looking at search behavior at scale unlocks a new way of gauging demand for whole industries, specific verticals, unique topics, individual brands, and beyond. This process is known as digital market intelligence.
What Is Digital Market Intelligence?
Digital market intelligence collects and analyzes thousands to (sometimes) millions of digital data points – from public, ethically sourced data – to get to the kind of insights that would traditionally require qualitative surveying.
Except that it’s a lot faster than surveying, and often, it’s more accurate because:
- The data reflects real behavior from real people who are free from survey bias or influence.
- It collects vast data sets in mere days (versus weeks or even months), ensuring timeliness and relevance.
- Data sets contain significantly more data representing huge swaths of the population (versus a small survey sample).
Image from Gray Dot Co, October 2024
Search data is one of the primary inputs in digital market intelligence because it provides an abundance of real user behavior data at an extremely low cost.
Note: DMI is most effective when looking at established industries with a meaningful digital footprint – it doesn’t work for everything!
Where Do We Get The Data?
When most of us think of “search data,” we think of Google data. And make no mistake, that’s a huge piece of the puzzle. Google is still a giant in the search game!
But more and more, people are looking outside of Google for information. In fact, some data sources name TikTok as the world’s largest search engine for Gen-Z users — not Google.
So, when we talk about search data, we’re still talking about Google and other search engines.
But we’re also stepping out of the silo and acknowledging that sources like YouTube, Pinterest, TikTok, etc. are sources where users exhibit active demand.
The datasets from each are extremely valuable for digital market intelligence because we can tap into them at a marginal cost via APIs, platform-specific reporting tools, and third-party tools.
(For a lot cheaper than traditional consumer insights work!)
- Google Search Console.
- Google Ads.
- Youtube API.
- Google Trends.
- Third-party tools like Semrush or Ahrefs.
- Pinterest.
- TikTok.
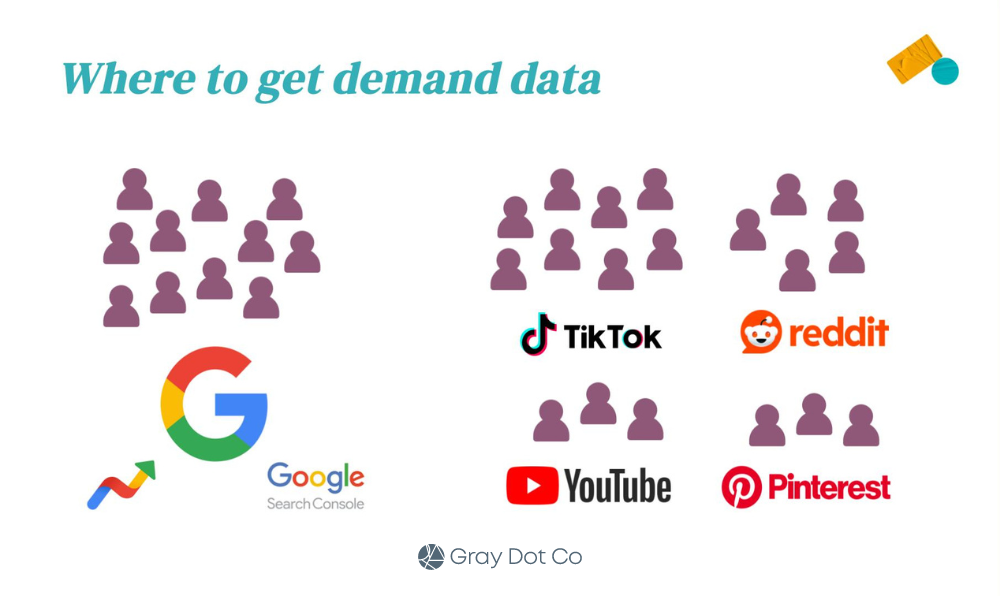 Image from Gray Dot Co, October 2024
Which Search Data Is Meaningful?
Now that we’ve established where we’re actually sourcing the data, what are we pulling?
Metrics we work with day in and day out are the raw inputs for calculations that answer big business questions:
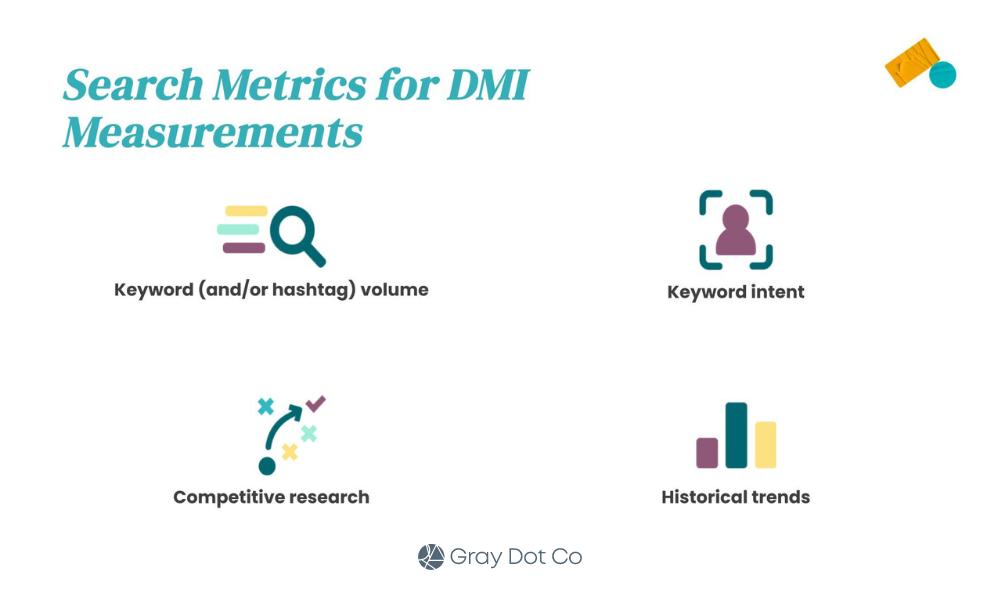 Image from Gray Dot Co, October 2024
- Keyword volume quantifies how often people actively look for products, information, or brands at any given time.
- Hashtag volume measures how much of the content landscape is saturated by a given topic or brand.
- Keyword intent identifies where people are in the customer journey, plus common behavior and language at different funnel stages.
- Competitor research compares demand for brands apples-to-apples, plus how much demand each captures in the landscape.
- Historical trends create a clear snapshot of shifts in demand to illustrate the trendline for any topic area over time.
What Can Search Data Tell Us About The Market?
Digital market intelligence can answer a lot of the questions marketing teams and even business leaders run into regularly.
Let’s take a look at some of the most common and illustrate how DMI can yield quick insights using search data.
Did The Market Grow Or Shrink YoY?
This is basically an exercise in summing active demand for the search terms that apply to your business or industry.
In a classic consumer insights sense, the size of the market is generally referred to as the Total Addressable Market.
To quantify TAM using search data, calculate the total keyword volume for the year across relevant search terms. You can source and export keyword volume at scale by using a third-party tool such as Semrush or Ahrefs.
Once you have your TAM total for both years, compare them to quantify the YoY difference. In terms of a calculation, it would look something like this:
[Total volume: Relevant keywords in year A] – [Total volume: Relevant keywords in year B] = YoY change in market size
Is An External Factor Having An Impact?
Your business tactics could drive a jump or drop in performance, but it could be something that’s out of your control altogether.
Leadership will want to know whether it’s the “tide” or something the “boat” (your marketing team) is doing.
Sometimes, the quickest and easiest way to tell is to turn to search data — specifically our often-overlooked friend, Google Trends.
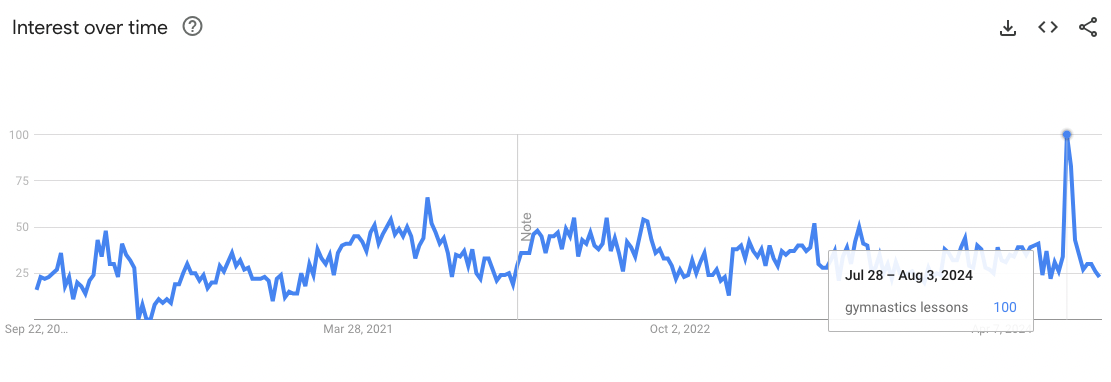
For the sake of example, let’s take a look at a simple case of an external factor driving increased demand for a service. Specifically, did the Olympics drive an increase in the demand for gymnastics lessons?
We know that the Olympics took place between Jul. 26 and Aug. 11, 2024. Now, we need to know how searches for “gymnastics lessons” in this window compare to other periods of time outside of the Olympics.
 Screenshot from Google Trends, September 2024
It’s clear from the data that there was a significant increase in interest in gymnastics lessons during the Olympic window.
We see a much smaller increase during the window of the 2020 Olympics (Jul. 23 – Aug. 8, 2021), but we can probably attribute this to COVID-19 and related restrictions/behaviors.
This type of insight isn’t just valuable for gauging whether the industry tide affected performance.
It’s also invaluable for determining when to lean into specific products, information, or trends through levers such as increasing paid spend, launching social campaigns, or shifting the overall marketing mix to meet the moment.
How Does Demand For Our Brand Compare?
Search data allows us to compare active demand for Brand A to active demand for Brand B to answer this age-old question.
For this exercise, pull keyword volumes for any queries that contain Brand A’s name in the string. Then, do the same for Brand B over the same window of time.
Add the keyword volume for each respective brand to come up with the brand total. Then, calculate the difference to understand how they stack up.
[Total volume: Brand A branded KWs over X months] – [Total volume: Brand B branded KWs over X months] = Difference in active brand demand
Are We Visible Enough To Drive Awareness?
The search landscape is one big conversation. “Share of voice” can tell you how much of the conversation the brand is actually participating in.
This measurement takes the total keyword volume a brand is competing for as a percentage of the total volume of possible, relevant keyword opportunities for the brand.
Since only 0.44% of users visit the second page of search results, start by identifying keywords where a brand ranks on page one (either traditional placement, featured snippet, or AI Overviews). Because if it’s not on page one, a brand isn’t actually competing in most cases.
Calculate the aggregate volume for these keywords, divide it by the total volume across all relevant keyword opportunities (regardless of ranking), and multiply by 100.
( Brand-eligible keyword volume] / [Landscape keyword volume] ) x 100 = [% Share of Voice]
It Starts With A Simple Shift In Perspective
Looking at familiar numbers in new ways starts to unlock business-critical narratives.
And it doesn’t stop with search data!
Data from social media platforms and forum sites hold their own unique opportunities to understand markets even more through the lenses of engagement and consumer behavior.
Step one is making the mental shift from search data to demand data.
It’s a subtle shift that can take us out of our siloed way of looking at data. Breaking down those walls is the key to making digital market intelligence work for you.
Go forth and find those illuminating answers — at the speed of modern business.
More resources:
Featured Image: ImageFlow/Shutterstock


